
Old Testament Timeline
1-page Visualization by time and geography
The Problem
- How do I make sense of the Old Testament?
- How do the 39 books of the Old Testament relate?
- I don't want a large accordion O.T. Timeline.
The Solution
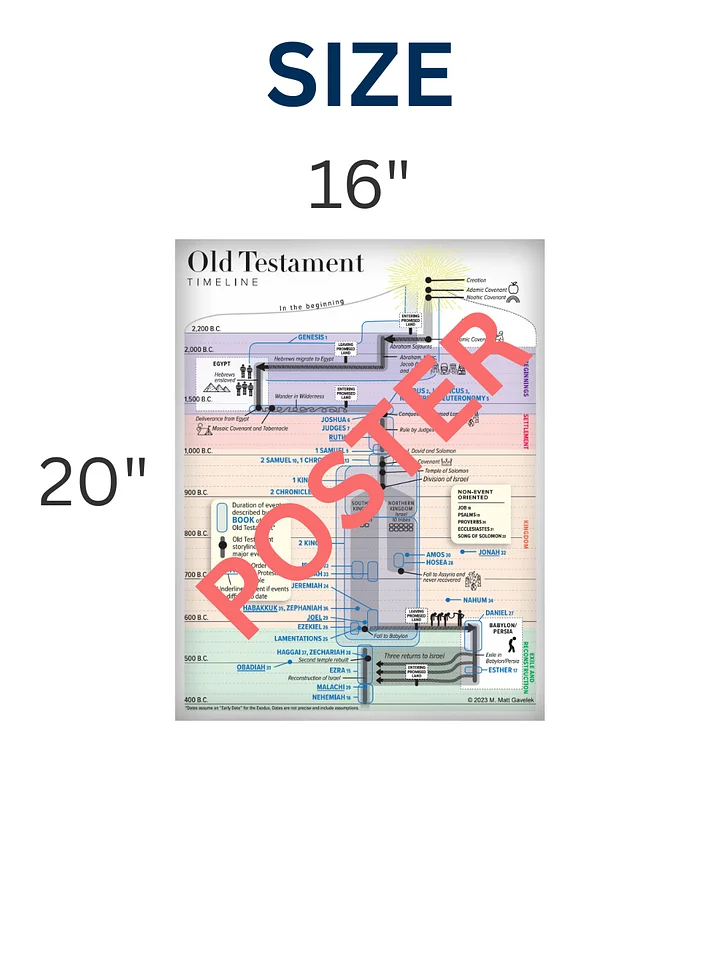
- Fits on 1 page
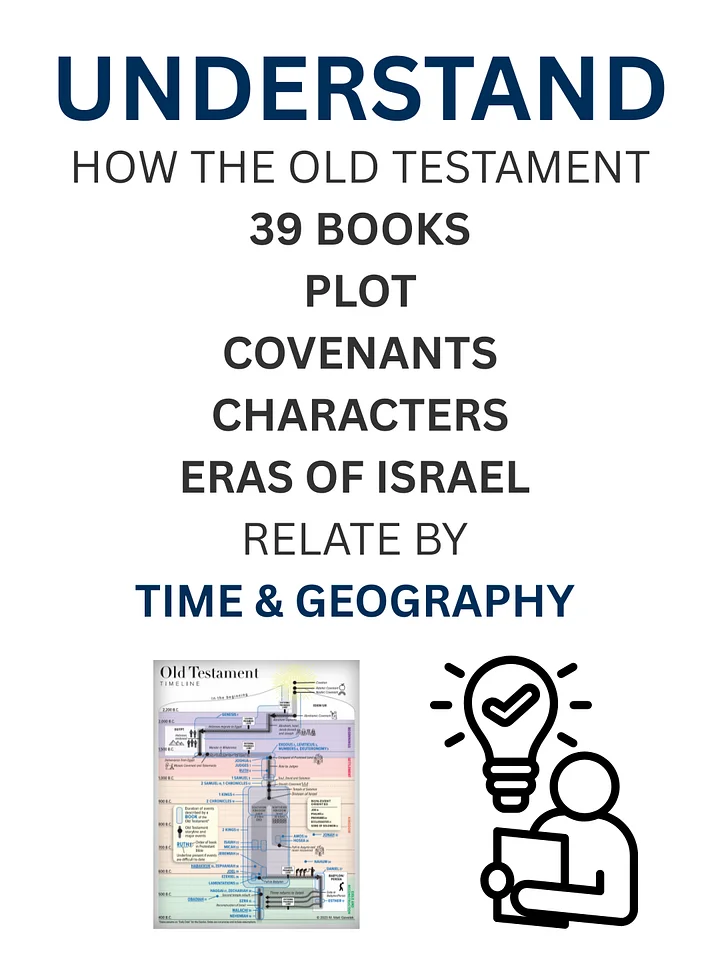
- Visualize how all 39 books of the Old Testament relate by time and geography
- Understand the plot, covenants, characters and eras of Israel


About
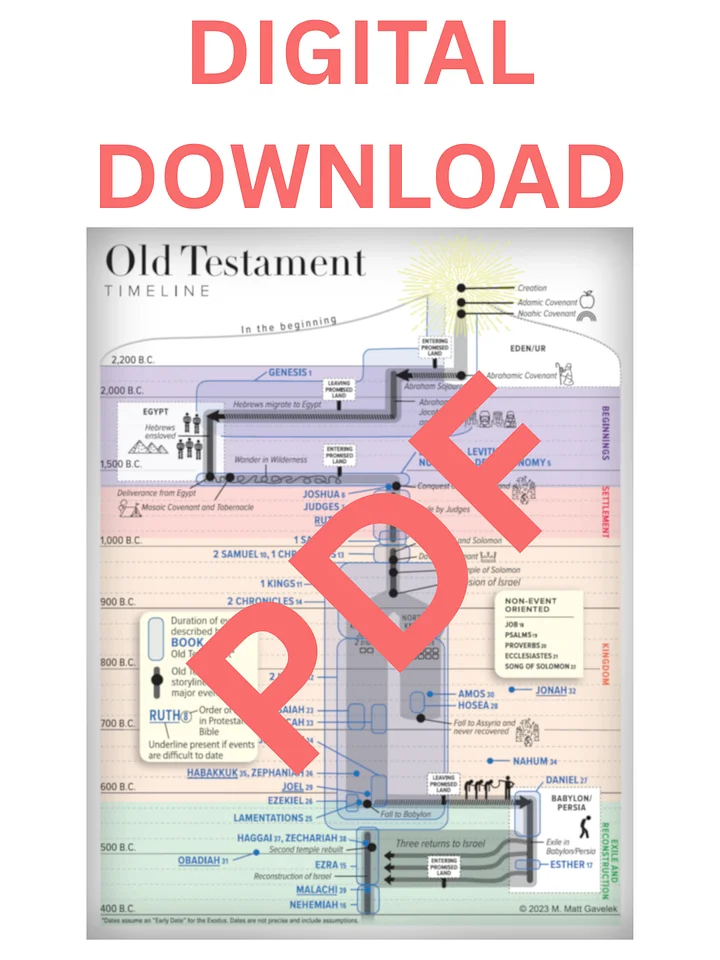
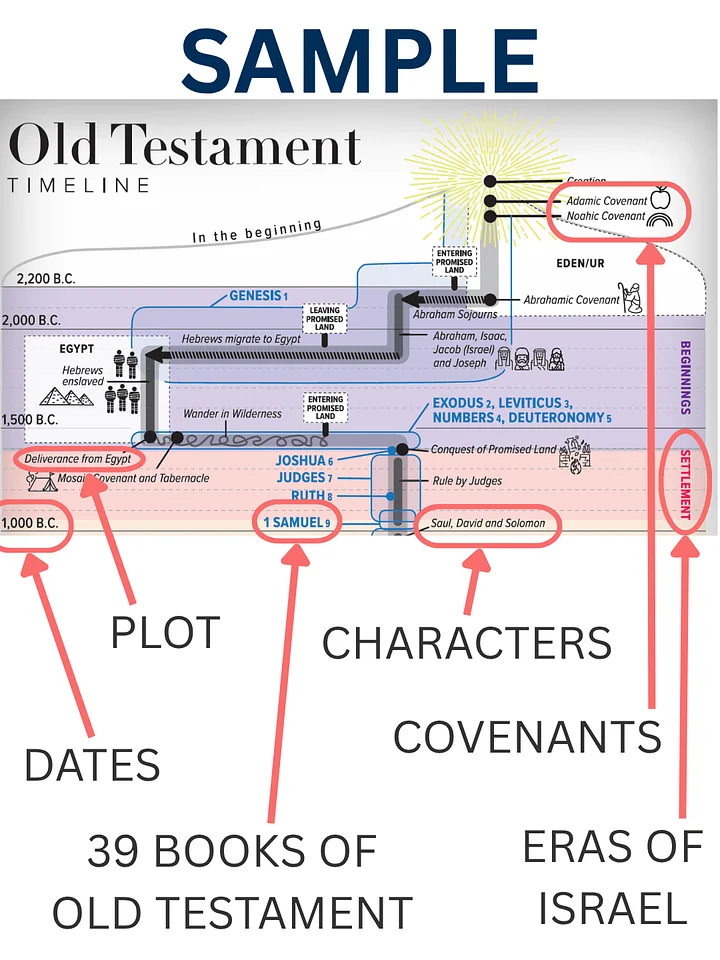
This Old Testament Timeline was created to make sense of the complexity of the Old Testament (O.T.). It condenses the important information of the O.T. (39 books, plot, covenants, characters and eras of Israel) to one page relating the information by time and geography. The timeline helps a user quickly find how something from the O.T. fits into the grand story of the O.T.. Devotional readers no longer need to pull out large charts or accordions to quickly understand the context of their O.T. devotional text.
The vertical axis (up and down) represents time. The horizontal axis (left and right) represents rough geography of the Ancient Near East. The story of the O.T. is shown in gray and black and moves across the landscape of the Ancient Near East over the span of 1,700 years. The 39 books of the O.T. are shown in blue. Blue outlines represent the time span of events that are described in a book (not when the book was written). Because the timeline orders the books of the O.T. chronologically, a number is provided by the book name stating the canonical placement of the book in the protestant Bible.
The timeline was created by an engineer who is also a bible teacher with the greatest care for historical accuracy. It has been reviewed by several Biblical scholars. Dates assume an early date for the Exodus. Some books are difficult to position in history and those books were given a blue underline to note that assumptions were needed to place them in time.